Under Obama’s health care law, from 2014 through 2016, the federal government will pay the full cost of opening Medicaid to anyone, who earns up to 133 percent of the federal poverty level, which is $15,282 for a single person this year. Over time, that share will decline until it reaches 90% in 2022 and future years. Compare that to the average 57% cost the federal government pays states for people now on Medicaid.
Under the Affordable Care Act (AFA), the Medicaid expansion was supposed to take effect nationwide, but the Supreme Court disrupted Congress’ plan last June when it ruled that states could decline to broaden the program, which is seemingly a foolish move since the federal government funds the overwhelming amount of coverage.
A report in the LA Times[i] relates a health and mortality study published in the Annals of Internal Medicine which warns that the health and thus the mortality rates of affected populations in some 24 states may be in jeopardy. Over five million in those 24 states will most likely be denied Medicaid coverage by Republican-controlled legislatures and governors.
Many governors and legislators in those states claim that either the cost is too great or the federal control is too stifling. Neither is true.
As was indicated, 100% is covered by the federal government through 2016, with the federal share declining to 90% by 2022, never going any lower. Turning down 100% of funding for covering the poor and uninsured, of course, cannot be justified, either for the uninsured or for state budgets. Even in 2022 when states must pay 10% of the costs, any cost-benefit study would prove that states lose more than they gain, to the tune of billions. What they lose must be covered by taxpayers, for states would have to cover the cost of emergency room visits by those still uninsured because of Republican denial of Medicaid. Also lost would be the billions in spending that newly insured citizens would bring to doctors and care facilities.
As for federal control, states have the option to put together their own plans with the approval of AFA representatives. Many have already done that, including Kentucky and California, for example. That argument does not hold water either.
Considering the lack of credence for either argument, one must assume that the decisions come out of spite or hatred of President Obama or of the federal government in general.
At any rate, the LA Times report notes that Massachusetts’ uninsured rate, now less than 5%, is the lowest in the nation. The ACA implementation has already lowered the percentage of working-age adults without healthcare coverage from 18% before ACA signups to 13.4% in April.
The study compared Massachusetts with 513 counties around the country with similar demographics, poverty rates and rates of health coverage, the 513 counties constituting the control group. They analyzed mortality rates in Massachusetts and the control group in the five years before and after the state enacted its healthcare reform.
Overall, mortality rates declined in Massachusetts by 2.9% compared with the control group, which meant that one death was prevented for every 830 people who gained health care coverage. Now the two groups compared had a much better prognosis for health than the almost six million who are denied health care coverage in the 24 states.
In spite of this population difference, even using only the 2.9% disparity, our state-by-state calculation shows that a total of almost 170,000 more people denied coverage will die each year in those states indicated in Table I below. Five states alone are denying 3.3 million uninsured poor health care coverage they deserve, projecting untimely deaths for almost 100,000 in one year.
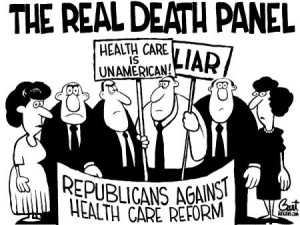
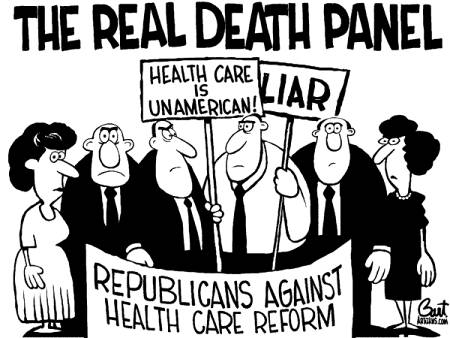
Are those the “death panels” that the Tea Party talked about in the early years of the ACA (“Obamacare”) legislation?
[i] http://www.latimes.com/business/la-fi-massachusetts-healthcare-20140506-story.html
Table I: States Rejecting ACA Medicaid for their Uninsured
|
State
|
Gov Party |
Legis Majority |
Governor |
Uninsured1 |
Increased2 Mortality |
|
Alabama |
GOP |
GOP |
Robt Bentley |
214,440 |
6,219 |
|
Alaska |
GOP |
GOP |
Sean Parnell |
31,060 |
901 |
|
Florida |
GOP |
GOP |
Rick Scott |
885,790 |
25,688 |
|
Georgia |
GOP |
GOP |
Nathan Deal |
468,980 |
13,600 |
|
Idaho |
GOP |
GOP |
Butch Otter |
68,170 |
1,977 |
|
Indiana |
GOP |
GOP |
Mike Pence |
241,670 |
7,008 |
|
Kansas |
GOP |
GOP |
Sam Brownback |
92,870 |
2,693 |
|
Louisiana |
GOP |
GOP |
Bobby Jindall |
239,110 |
6,934 |
|
Maine |
GOP |
GOP |
Paul LePage |
26,410 |
766 |
|
Mississippi |
GOP |
GOP |
Phil Bryant |
165,210 |
4,791 |
|
Missouri |
Dem |
GOP |
Jay Nixon |
234,000 |
6,786 |
|
Montana |
Dem |
GOP |
Steve Bullock |
70,000 |
2,030 |
|
North Carolina |
GOP |
GOP |
Pat McRory |
378,980 |
10,990 |
|
Nebraska |
GOP |
GOP |
Dave Heinerman |
80,000 |
2,320 |
|
Oklahoma |
GOP |
GOP |
Mary Fallin |
148,090 |
4,295 |
|
Pennsylvania |
GOP |
GOP |
Tom Corbett |
314,420 |
9,118 |
|
South Carolina |
GOP |
GOP |
Nikki Haley |
189,660 |
5,500 |
|
South Dakota |
GOP |
GOP |
Dennis Daugaard |
29,540 |
857 |
|
Tennessee |
GOP |
GOP |
Bill Haslam |
238,860 |
6,927 |
|
Texas |
GOP |
GOP |
Rick Perry |
1,293,120 |
37,500 |
|
Utah |
GOP |
GOP |
Gary Herbert |
77,370 |
2,244 |
|
Virginia |
GOP/Dem |
GOP |
Bob McDonnell /Terry McAuliffe |
229,590 |
6,658 |
|
Wisconsin |
GOP |
GOP |
Scott Walker |
117,900 |
3,419 |
|
Wyoming |
GOP |
GOP |
Matthew Mead |
19,270 |
559 |
|
Total denied coverage & total projected deaths with 2.9% higher mortality rate |
5,854,510 |
169,781 |
|||
|
|
|
|
|||
|
1. http://www.urban.org/health_policy/health_care_reform/map.cfm |
|
|
|||
|
2. Increased mortality calculated for each state times 2.9% |
|
|
|||


